Interactive UIs in Semantic Link Labs
Semantic Link Labs now offers interactive UIs which give you full control over key areas of Fabric and Power BI - all from a single function call.

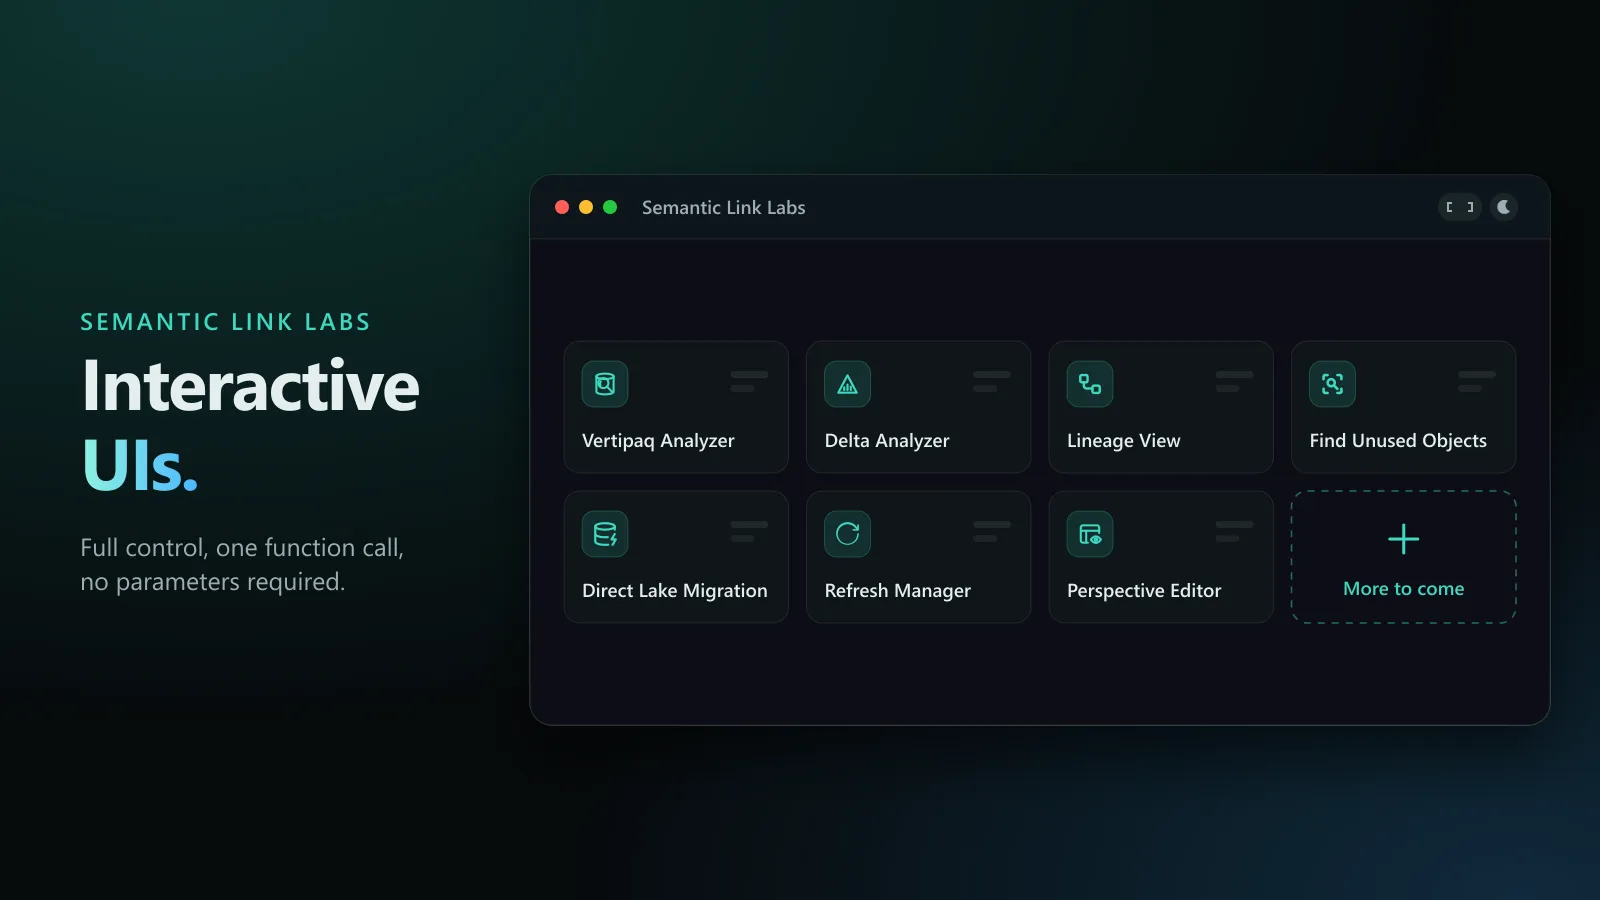
From the beginning, the goal of Semantic Link Labs has been to make complex tasks simple. Whether it was migrating a semantic model to Direct Lake, running the Best Practice Analyzer or analyzing a model’s memory footprint, these tasks could be accomplished by running a function in a Fabric notebook. The library has also been heavily focused on automation scenarios - running these same tasks at scale across many semantic models and workspaces.
However, even simple tasks still required writing some code. You had to know which function to call, set the right parameters and interpret the output. That is no longer the case!
The Solution
Semantic Link Labs now has a set of interactive UIs. Simply call a function - you don’t even need to set any parameters - and you get an interactive user interface (UI) which gives you full control over that area of Fabric / Power BI.
It should be noted that none of the formative capabilities are going away. All of the automation scenarios are still fully supported and will continue to be supported. This new path simply provides more options for more users, and adds UI support for things which should have UIs.
Not your typical notebook
Despite living inside of a notebook, these UIs give a full-screen experience with a modern design. They give you the feel of a modern web application - and most certainly not a notebook! Honestly, when I first showed this to folks they didn’t believe me that I was using a notebook!
All of the UIs share the same design and the same set of features:
- Full-screen mode (one click in the top right corner).
- Light and dark mode.
- A workspace & item picker (i.e semantic model, lakehouse), so you don’t need to know any names or IDs up front. You can also switch to a different item at any time.
Getting Started
All you need is a Fabric notebook. Install the library (or load it into a custom Fabric environment so you don’t have to install it each time).
%pip install semantic-link-labsThen import the library and call the function for the UI you want to use. That’s it!
import sempy_labs as labs
from sempy_labs import semantic_model

semantic_model.refresh_manager()
The Interactive UIs
Here are the interactive UIs available as of the writing of this article.
Vertipaq Analyzer
import sempy_labs as labs

labs.vertipaq_analyzer()
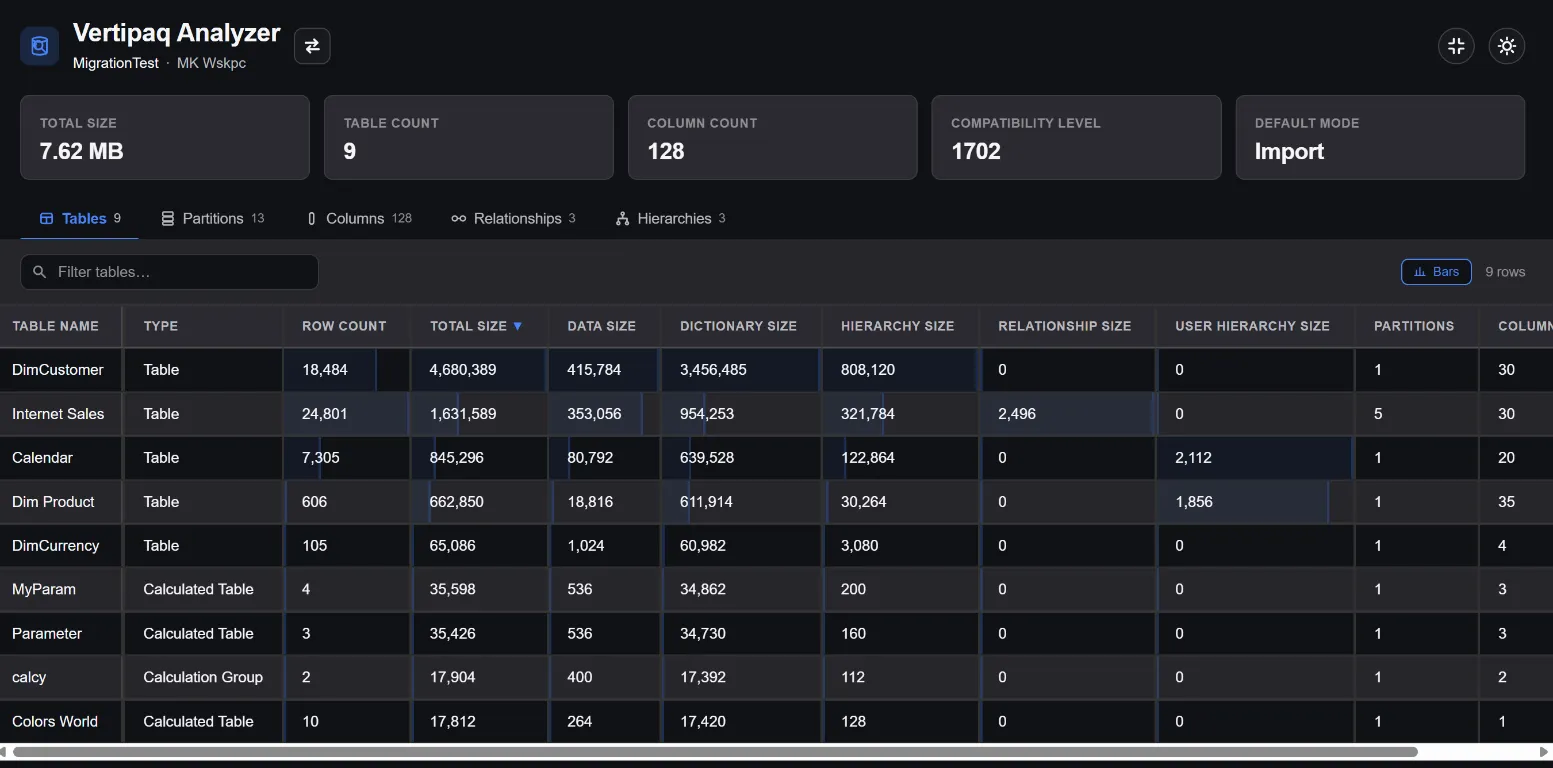
Vertipaq Analyzer shows the memory footprint of your semantic model across the model, tables, columns, partitions, relationships and hierarchies. You can filter each view and toggle data bars to quickly find the largest objects. If your model is in Direct Lake mode (over a lakehouse), there is also a Delta Analyzer button which analyzes the source delta tables and merges the results right into the view.
Delta Analyzer
import sempy_labs as labs

labs.delta_analyzer()
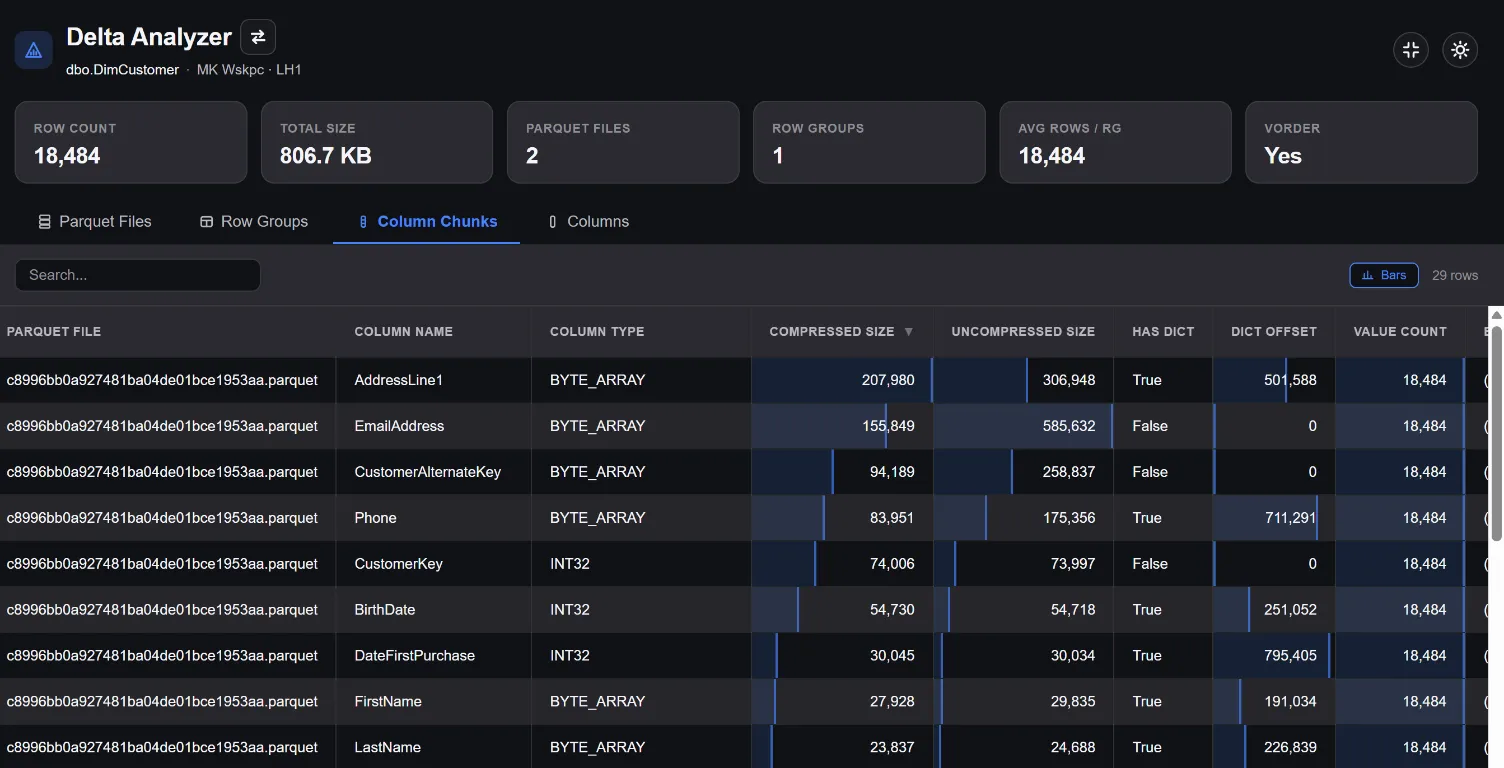
Delta Analyzer breaks down a delta table into its parquet files, row groups, column chunks and columns. Just pick the workspace, lakehouse and table. This is especially useful for understanding how well your delta tables are set up for Direct Lake.
Lineage View
import sempy_labs.semantic_model

semantic_model.lineage_view()
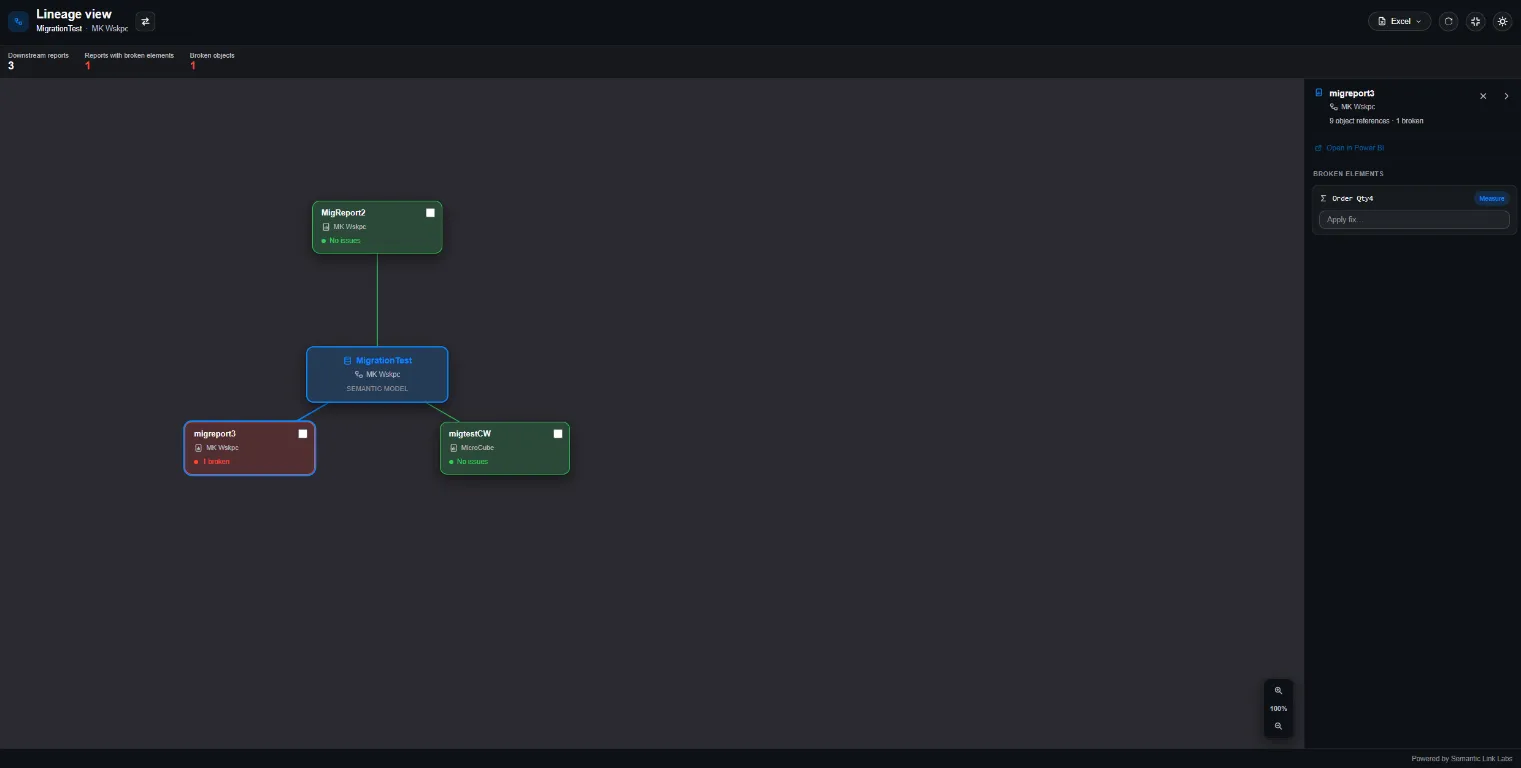
Lineage View shows your semantic model along with all of its downstream reports (across workspaces). Each report is scanned for broken elements - references to columns, measures or hierarchies which no longer exist in the model. Not only does it find them, it lets you fix them. Select a valid replacement for each broken object, click save and the reports are updated. You can also rebind reports to a different semantic model and even scan Excel files on your machine which connect to the model.
Find Unused Objects
import sempy_labs.semantic_model

semantic_model.find_unused_objects()
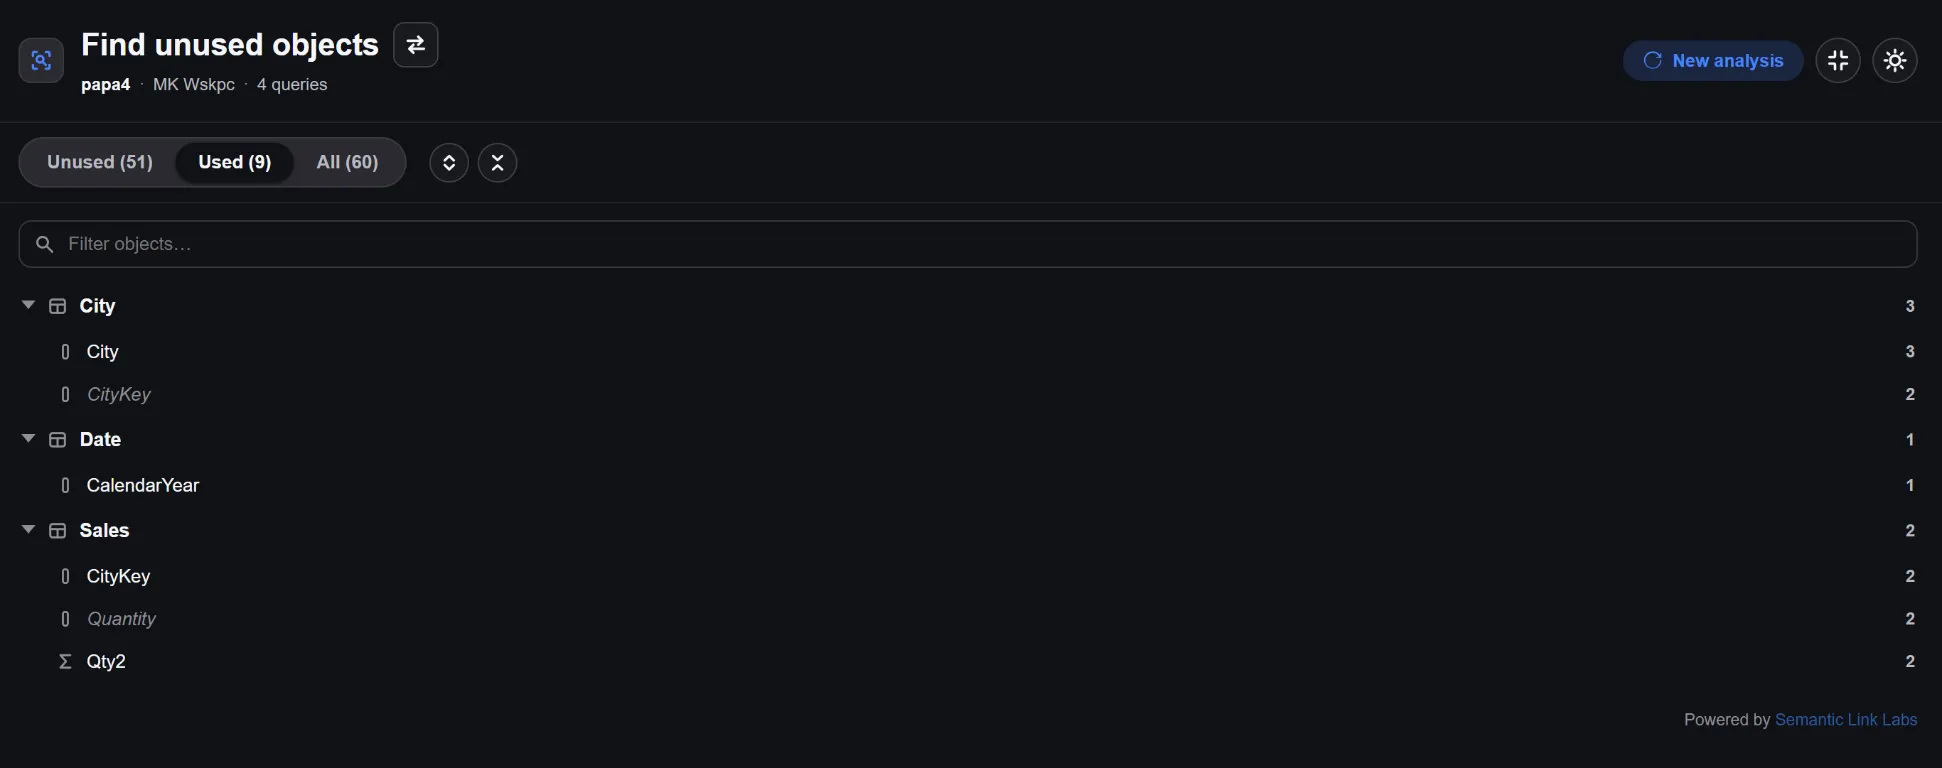
Removing unused objects is one of the easiest ways to make your model smaller and faster. The hard part is knowing what is actually unused. Find Unused Objects offers 2 methods for figuring this out:
- Workspace monitoring - analyzes the DAX (and MDX) queries run against the model over a time frame of your choosing.
- Downstream reports - analyzes the objects used in the reports built on the model.
Dependencies are taken into account (i.e. a column which is only used inside a measure is not unused), and the results are shown as a table -> column/measure tree.
Direct Lake Migration
import sempy_labs.semantic_model

semantic_model.migrate_to_direct_lake()
In my previous post on Direct Lake migration, the process consisted of running a series of functions in a notebook. Now it is a wizard which walks you through the entire process:
- Analyze - see which tables will be migrated and which objects will be dropped.
- Configure - create a new Direct Lake model or convert the existing model in place (a backup is taken), and choose a lakehouse or warehouse as the source.
- Preview - review the plan before anything is done.
- Create - build the Direct Lake model and see a validation summary of what was migrated.
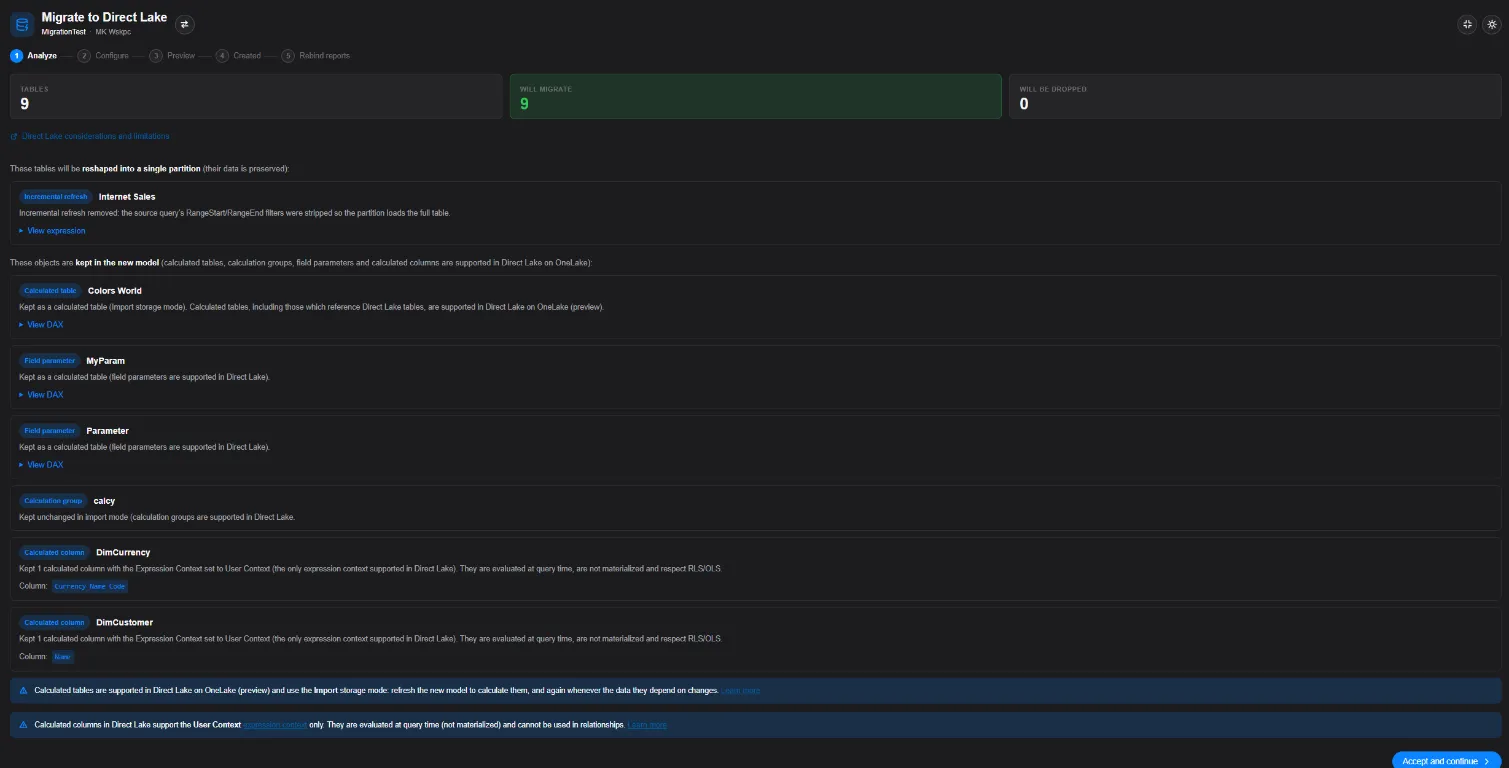
Additionally, calculated columns and calculated tables can now be migrated as well (using Direct Lake on OneLake, currently in preview).
Refresh Manager
import sempy_labs.semantic_model

semantic_model.refresh_manager()
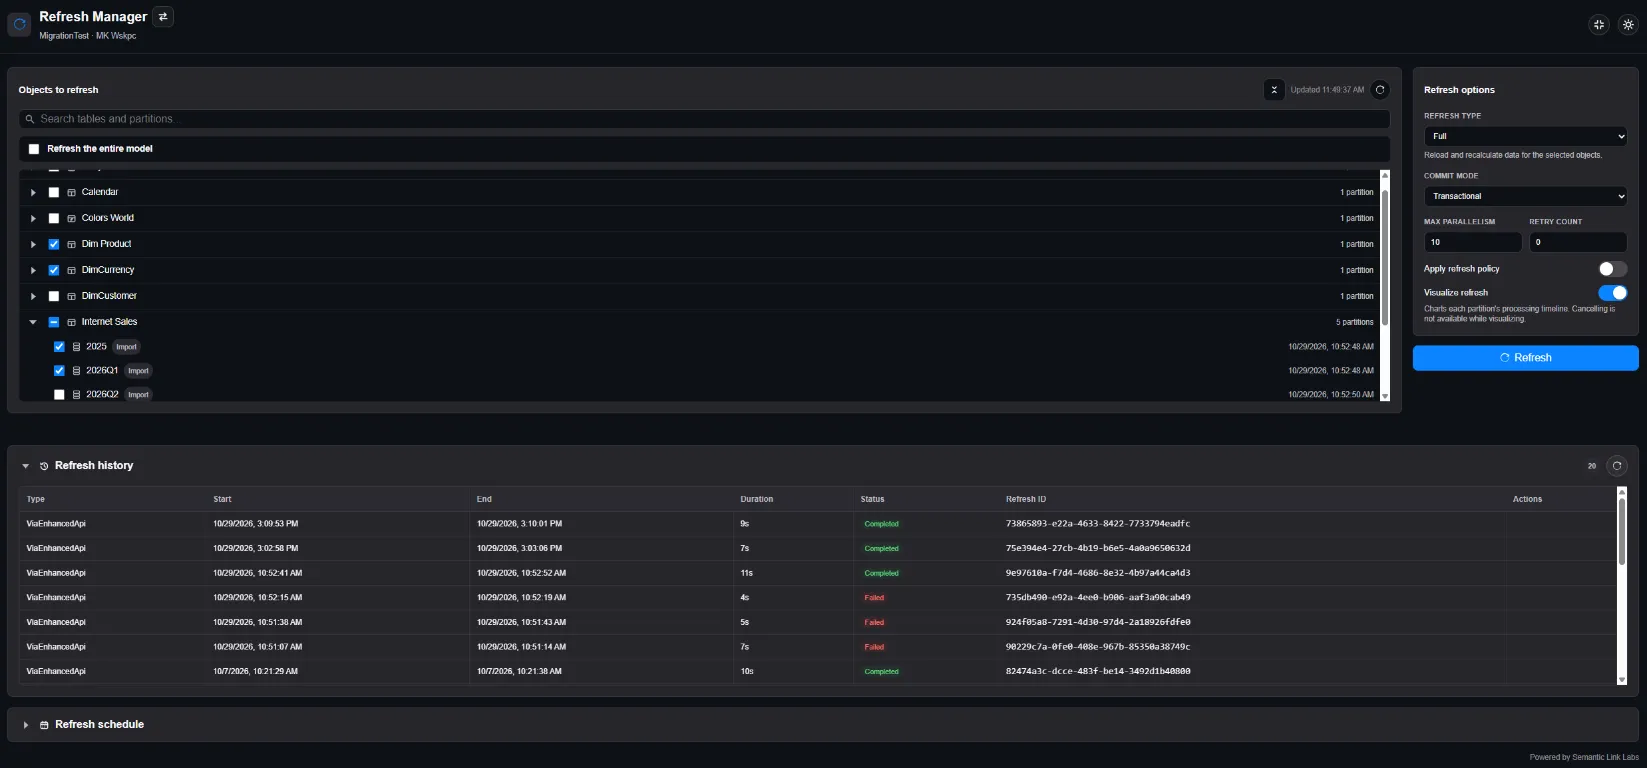
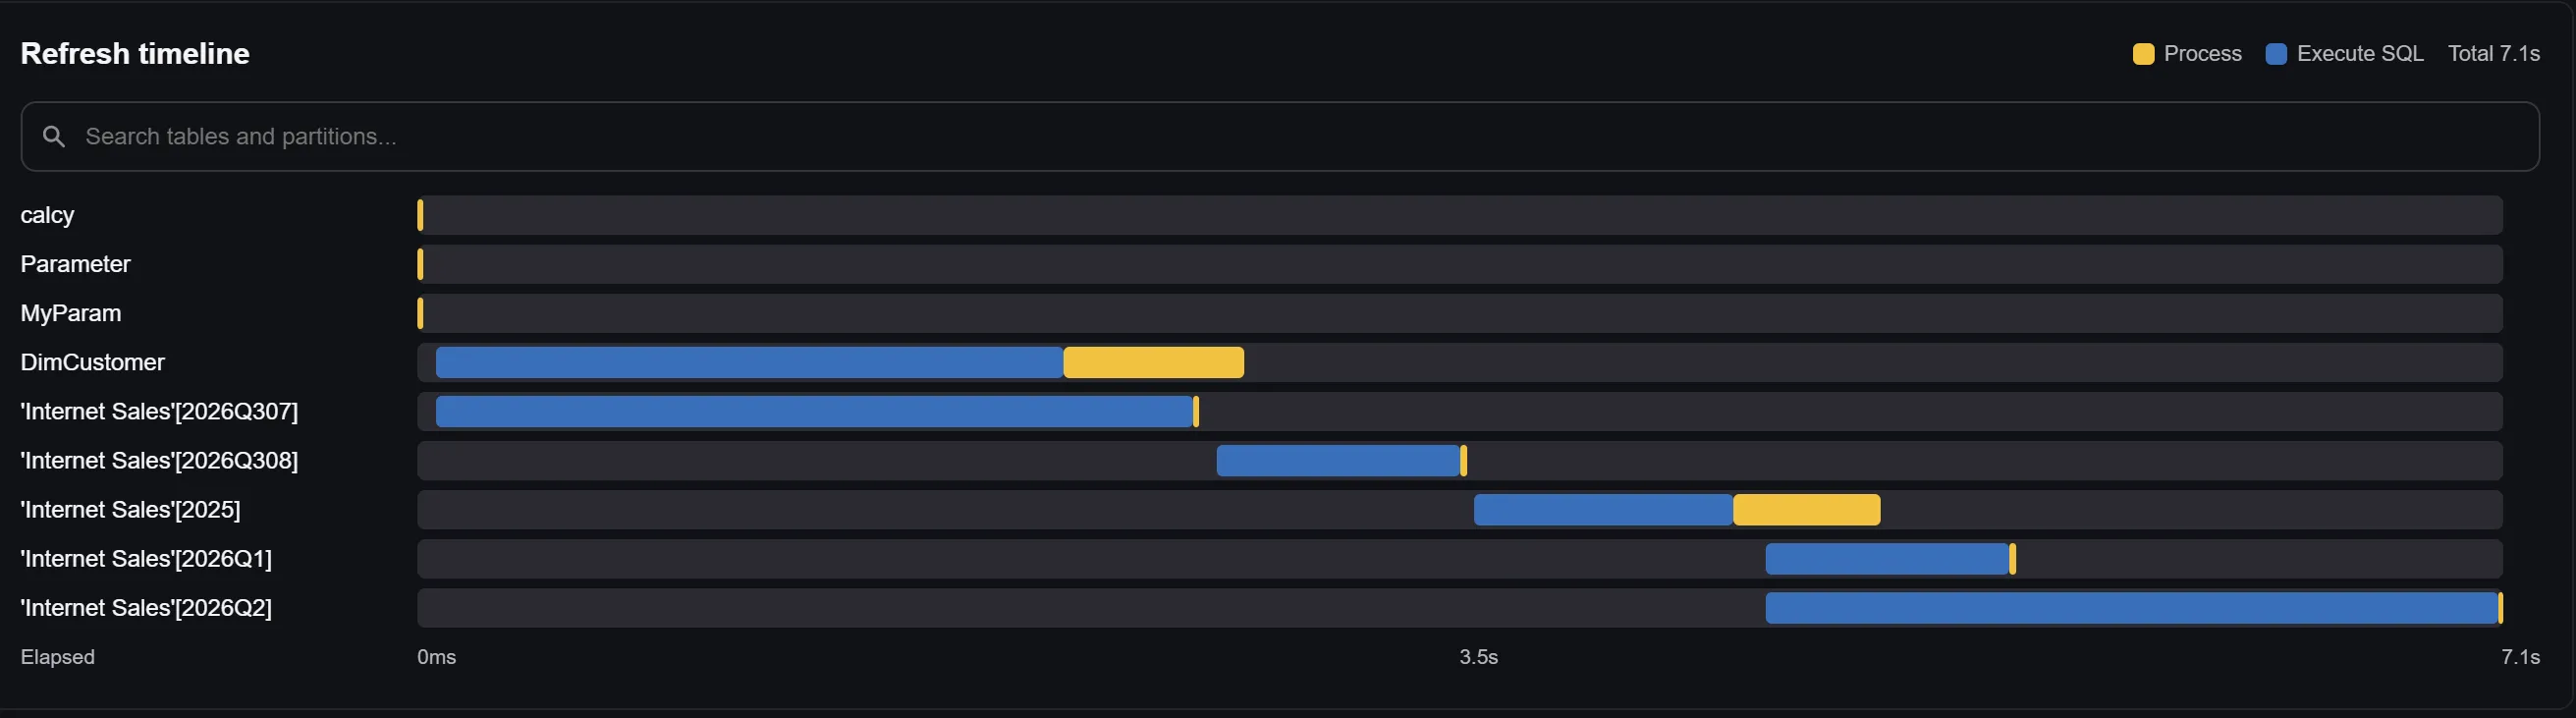
Refresh Manager gives you full control over refreshing your semantic model. Refresh the entire model or just specific tables or partitions, and set the refresh type, commit mode, max parallelism, retry count and whether to apply the refresh policy. You can watch the status of the refresh live, browse the refresh history and see the scheduled refresh settings. My favorite feature is ‘Visualize refresh’ - this runs the refresh under a trace and shows a timeline of how long each table and partition took to process. This makes finding the bottleneck in a slow refresh quite simple.
Perspective Editor
import sempy_labs.semantic_model

semantic_model.perspective_editor()
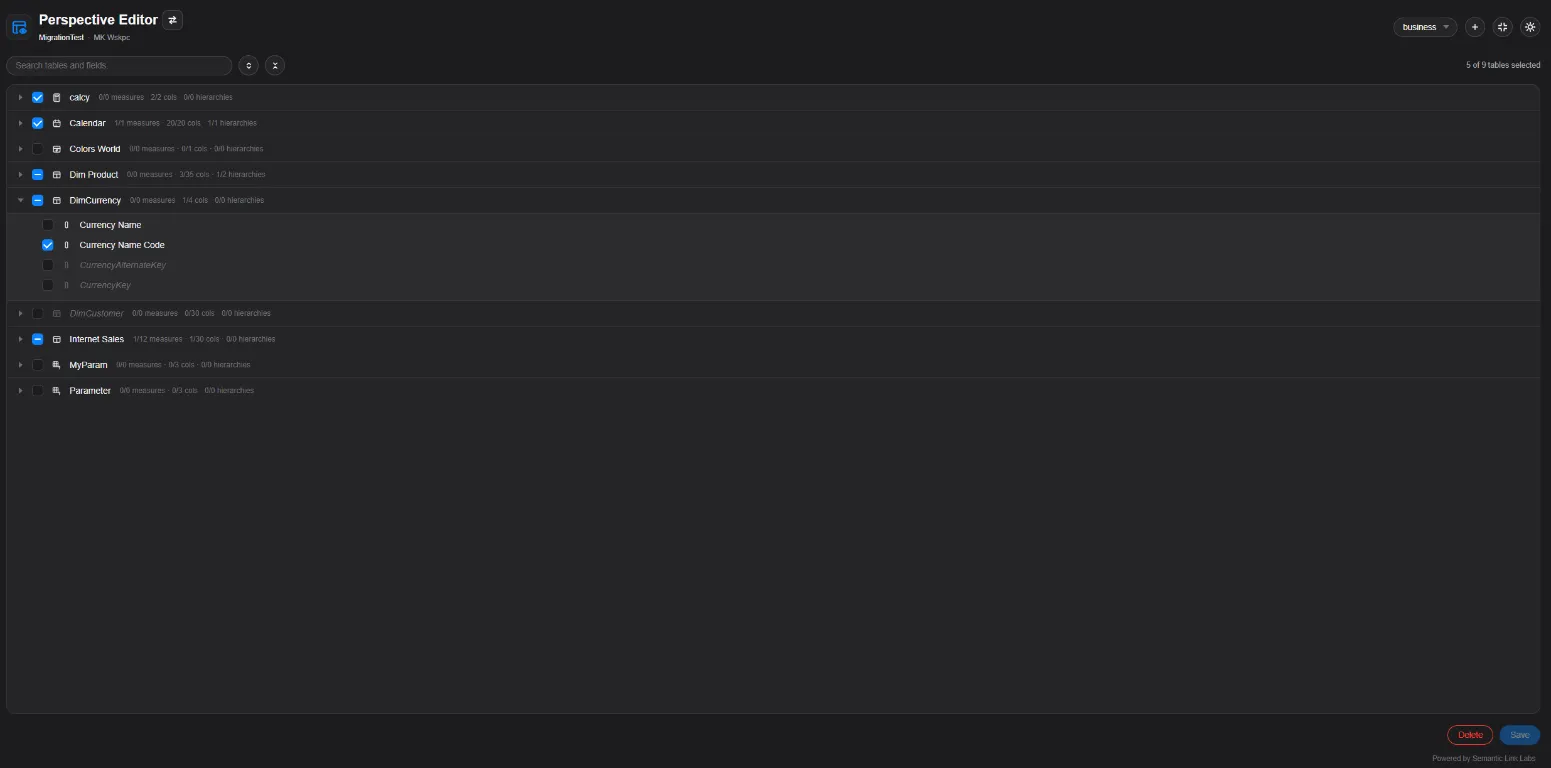
Perspectives are great for giving users a focused view of a large model but have never been easy to manage. The Perspective Editor lets you create, edit and delete perspectives by simply selecting the tables, columns, measures and hierarchies which belong in each one. Nothing is saved to the model until you click save.
What about automation?
As mentioned above, nothing has changed here. The UIs are built on top of the same functions which power the automation side of the library. Some of the functions also have a visualize parameter which you can set to False in order to return the results as dataframes instead of showing the UI.
results = labs.vertipaq_analyzer(dataset="Sales Model", workspace="Finance", visualize=False)
results["Tables"]
Next Steps
These are just the first set of interactive UIs - there are more to come. If you want to build your own UI in the same style, check out the UI styling guide in the repo. And if you have suggestions for which UI should come next, please post them on the GitHub issues page.
Conclusion
I hope these interactive UIs make Semantic Link Labs useful to even more people. Complex tasks were already simple to run. Now you don’t need to write anything more than a single function call to have full control. Stay tuned!





Comments 0
No comments yet. Be the first to share your thoughts.